Correlation Chains
Correlation Chains
SMBC had a interesting comic recently on correlation chains. It suggests the new "Funtime Activity" of creating correlation chains. As a statistician, I naturally wanted to evaluate the methodology.
The basic idea is that you start with a given variable X1 ("Amount of Sex" in the comic) and start by linking to a positively correlated variable X2 ("Happiness"). Then X2 is positively correlated to X3 ("Income") so you expand the chain to X1 → X2 → X3. Eventually you end up at variable Xn ("Likelihood that you are, in fact, J.K. Rowling") that's you conclude is positively correlated the variable X1.
Incidentally, this isn't the first time this topic has appeared on SMBC.
Intuition
On a intuitive level, correlation chaining seems plausible. The hand-wavy idea of correlation is that I can more or less replace one variable with another without losing too much information. Thus I should be able to just substitute variables right on down the line without much change. To put it in technical terms, we have some intuition that correlation is transitive such that if A is correlated with B, and B is correlated with B, then A is correlated with C.
This intuition is mostly correct, although in general it is false. For vectors with sufficiently strong correlation, we can perform this chaining for a while and still have a valid inference. Unfortunately, the qualifications of sufficiently strong and for a while are quite restrictive.
Example
Just to provide a concrete example, consider the following correlation chain.
You can check that
\[ \operatorname{Cor}[X_{1}, X_{2}] = \operatorname{Cor}[X_{2}, X_{3}] = \operatorname{Cor}[X_{3}, X_{4}] = 0.5 \]
while
\[ \operatorname{Cor}[X_{1}, X_{4}] = -1 \].
So, we have our counterexample; correlation chains can fail dramatically, ending up at a perfectly anticorrelated vector. This also occurred quite quickly for a rather strong correlation which hints at how restrictive our conditions are going to have to be.
Nerdy Details
What exactly can we say about correlation chains? Of particular interest is the the worst-case and average-case number of links we can have before encountering an anti-correlated variable. Along the way, we'll learn a bit about a geometric interpretation of correlation and how to sample variables with a specific correlation.
Correlation is just cosines
The first thing that we need to notice is that correlation is just the cosine of the angle between two vectors. To see this, let's just look at the formula for correlation.
So now let's think about that special case I started with. If you look really carefully, it's clear how I generated this data. Starting with the first vector, I just cycle the entries of the vector and flip the sign. If you can visualize 3 dimensional space, you'll notice that this is just a rotation of π / 3.
How many links can we make in the worst case?
So how can we minimize the correlation between vectors \(A\) and \(C\)? It's exactly the case when vector \(C\) is rotated exactly \(\arccos(\rho_{AB}) + \arccos(\rho_{BC})\) degrees from from A.
Then if we have a fixed correlation, the worst case is that we keep on rotating an angle of \(\arccos{\rho}\) for each link. Thus the chain will reach an anticorrelated vector in \(\pi / \arccos{\rho}\) links. Recalling the example chain which had correlation 0.5, the chain reached the perfectly anticorrelated vector in exactly \(\pi / \arccos(0.5) = 3\) links. More generally, let's look at the minimal number of links as a function of the correlation.
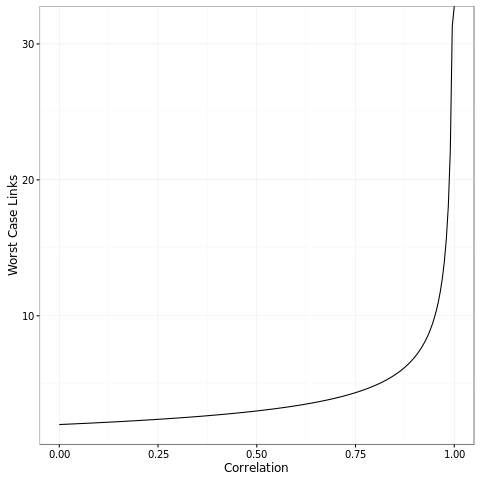
The main takeaway from this graph is that you need fairly strong correlation to have more than a couple links in the chain. However, once you have very strong correlations like 0.9999, you can make a lot of links in the chain as the function asymptotes to infinity. If you want to be able to do \(n\) links, you need a correlation as strong as \(\cos(pi / n)\). So for 5 links you need correlations of at least 0.8. For 1000 links, you need correlations of at least 0.99999.
How to sample vectors with a given correlation
I don't particularly want to do the math for the average-case, so the remainder of our results will rely upon simulations. To do this I need to sample uniformly from all vectors with the right correlation. To make this easier, we instead sample uniformly from the unit n-sphere. This is fine because correlation doesn't depend upon scaling so we can just work with unit vectors.
Sampling from the unit n-sphere is quite easy. You sample from a multivariate normal with spherical covariance and scale the vector appropriately.
But now we need to get the correlation correct. The idea here is that we need to get our vector and a vector orthogonal to our vector. As a nice connection to statistics, this is just the residuals of the regression.
\[ \epsilon_{} = (I_{n} - x(x^{T}x)^{-1}x^{T}) %*% y \]
We'll scale this vector so it lies on the n-sphere. Now we just need to rotate the starting vector the appropriate angle. Some basic trigonometry will tell us that we should use the scaling:
\[ \sin(\theta) \epsilon + \cos(\theta) x \]
Which, because \(\rho = \cos(\theta)\) can simplify to become
\[ \sqrt{1 - \rho^{2}} \epsilon + \rho x \]
If you want to verify that this works, try the following R code:
sample_correlated <- function(x, cor) {
    n <- length(x)
    x <- scale(x)

    ## x(x^{T}x)^{-1}x^{T}
    Q <- qr.Q(qr(x))
    P <- tcrossprod(Q)

    y <- rnorm(n)
    y <- (diag(n)-P) %*% y
    y <- scale(y)
    y <- sqrt(1 - cor^2) * y + cor * x

    return(y)
}
Simulating a correlation chain
Once we've simulated a single variable, we can start simulating the entire correlation chain. Here's a figure of an example chain where the correlation is 0.5.
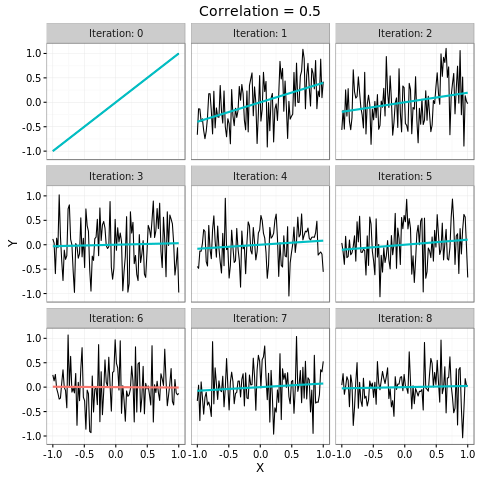
As we can see, the correlation chain isn't particularly compelling. We see some relationship in the first iteration, but by a few iterations we're getting more or less uncorrelated relationships. On iteration 6 we reach our first anti-correlated variable, twice the number of the worst-case.
Average number of links until the first anticorrelated variable
Now that we can sample from this distribution, let's see how long it's going to take us on average to get to an anticorrelated variable.
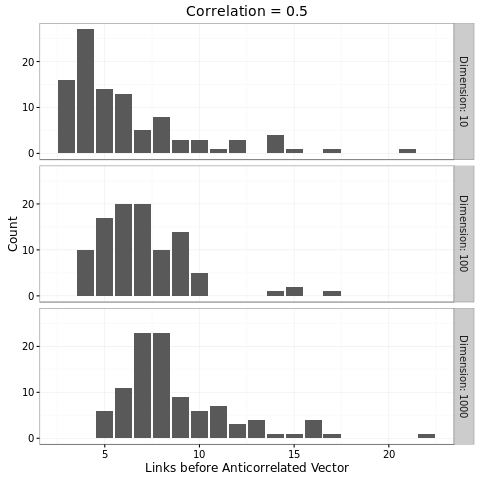
It seems that we have a dependence upon the dimension. This makes sense; if I rotate on a circle, I don't have many places to go. But if I rotate on a sphere, I have lots of different places to go. With n dimensions I have a even more.
Takeaway
So the ability to use correlation chains depends heavily upon the strength of the relationships and the number of links. If we have highly correlated variables, we can get away with a few links before things break down. Otherwise, we have no guarantees that our endpoint is positively correlated.
What does this mean for the correlation chain in the SMBC comic?
Unfortunately, it doesn't look good. Lets look at the chain.
- Amount of Sex
- Happiness
- Income
- Likelihood of owning a signed copy of a Harry Potter novel
- Number of possessions that J.K Rowling has touched
- Likelihood that you are, in fact, J.K. Rowling
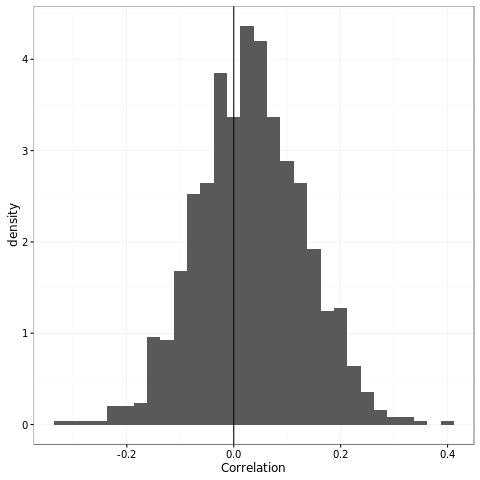
We're technically making 5 links since the connection between 4 and 5 is omitted in the comic. For 5 links with equal correlation, we need correlations above 0.8. I doubt that any of these relationships are correlated at the 0.8 level, so it's possible for the correlation to actually be negative. However, if we look at the average case (assuming generous correlations of 0.5), we see we're somewhat more likely to have a positive correlation than a negative correlation, but not by much. It certainly isn't good enough to feel confident about our conclusions.
Correlation is not causation
I would be remiss if I didn't add a final parting caveat. Everything above just deals with correlation; this is quite different from causation. Causation is tricky stuff and I should really read more about it. But I would assume that, at the very least, to support a causal claim based upon a correlation chain that each link has to be causal.
So the final panel? It seems to make a causal claim that the likelihood that you're JK Rowling increases your amount of sex. A recent CMU study suggests that the link between sex and happiness is not causal. Since the first link in the chain isn't causal, the conclusion is just not supported by the data. I expect better from my web comics ;).