Diagnosing Bad Hypothesis Tests
Let's suppose you see the following histogram of p-values: what do you think is going on?
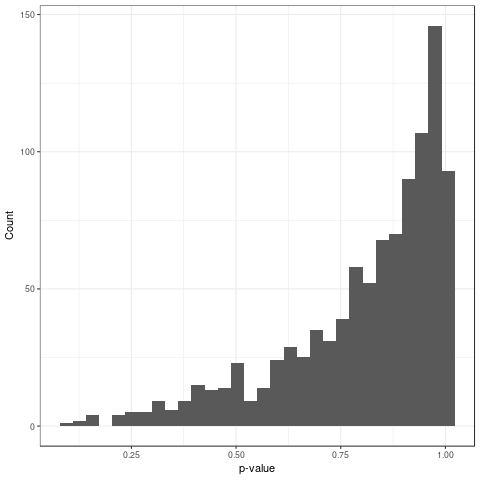
At first I thought there had been some mistake in the code where \(p = 1 - p\). But no, it's not a coding mistake.
Alternatively it could be an ill-advised one-sided test. However this isn't the case since it's two-sided.
My final thought was that some assumption broke. It's always the last thing you think of.
The test that I was running is the Kolmogorov-Smirnoff (KS) test for goodness-of-fit. It's designed to test whether a sample came from a particular distribution by looking at the maximum difference between the CDF of the sample and the CDF of the distribution. Since I was working with scaled (mean = 0, sd = 1) data I just compared with the \(N(0,1)\). That's when I saw a figure much like Figure fig:conservative-p-values which is actually generated from the null.
This is bad because p-values under the null should be uniform otherwise we don't have the specified Type-I error. In this case we have a conservative test so the actual Type-I error is less than than the specified Type-I error. Usually people are more concerned when a test is liberal (actual Type-I error greater than specified) since the whole point of hypothesis testing is to control the Type-I error rate. However, conservative tests are concerning as well since they leave power on the table and make more Type-II errors than necessary.
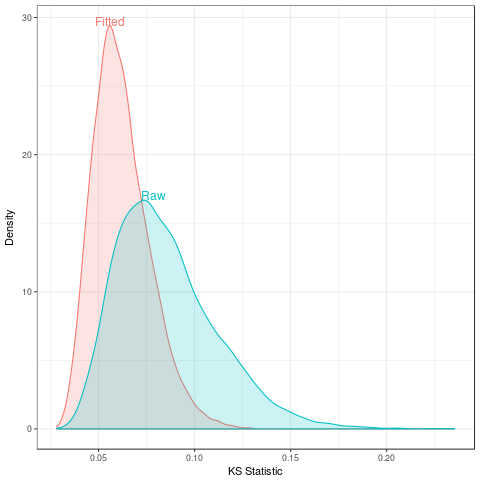
I said before that an assumption broke. It turns out that what's happening with the scaled is that the CDFs are shifted closer together. The null distribution for the KS statistic doesn't take this into account; it assumes your distribution was fixed and not fitted to the data. Scaling the data implicitly fits the mean and standard deviation of the normal and thus the assumption is broken.
To emphasize how fragile this assumption makes the KS test I draw standard normal data and try the KS-test with the scaled data with the raw data. This rescaling is essentially doing nothing to the data, but the effects on the test are substantial. Figure fig:ks-test-statistics show that the distribution of test statistics for the fitted distribution (red) is pushed left which will result in low p-values since the KS test assumes the raw distribution (blue) is the null.
With the constraint that you need to specify a single distribution the KS test becomes less useful. Especially since I wasn't the one doing the scaling. Fortunately there are workarounds.
For normal distributions there's a modification of the KS test which
will work for the fitted data: the Lillifors test. It uses the same
test statistics just with the correct distribution. I inadvertently
replicated the original paper's 1 method
for determining that distribution in Figure fig:ks-test-statistics;
it's just a Monte Carlo sample from the null. There's also an analytic
approximation 2 used by R's nortest and
Python's statsmodels.
This idea can be generalized to other location-scale families since the effect of parameter estimation is the same as a linear transformation to "canonical" form like the standard normal. There are also analytic ways of calculating these null distributions 3.
Outside of these families the effect of parameter estimation could depend on the unknown parameters which complicates things greatly. Fortunately you can use the bootstrap in these cases 4.
References
Footnotes:
Lilliefors. (1967). On the Kolmogorov-Smirnov test for normality with mean and variance unknown. JASA. link
Dallal and Wilkinson. (1986). An analytic approximation to the distribution of Lilliefors's test statistic for normality. Taylor & Francis Group. link
Durbin. (1973). Distribution theory for tests based on the sample distribution function. SIAM.