Driving Above Average
At lunch my friend stated that "Most people are so arrogant; they think they're better than the average driver". As a stats nerd I gleefully pointed out that all but one person can be above "average" in driving provided that there exists a single person terrible enough to drag down the mean. Confronted with this fact, my interlocutor retreated, somewhat begrudgingly, to the statement that "Most people are so arrogant; they think they're better than the median driver".
This is where things get good.
Consider the following model, everyone observes 100 other drivers. Each driver has an ability score between 0 and 1 and to determine your own score you just take the percentage of times you're better than the other driver. This results in the following qqplot.
nDrivers <- 1000
nObservations <- 100

set.seed(42)

scores <- runif(nDrivers)

plot(quantile(scores))

unbiased_quantile <- rep(NA, nDrivers)
biased_quantile <- rep(NA, nDrivers)

for(ii in 1:nDrivers) {
    unbiased_quantile[ii] <- mean(scores[ii] >= sample(scores[-ii], nObservations, replace = TRUE))
}

qqplot(scores, unbiased_quantile)
abline(a = 0, b = 1)
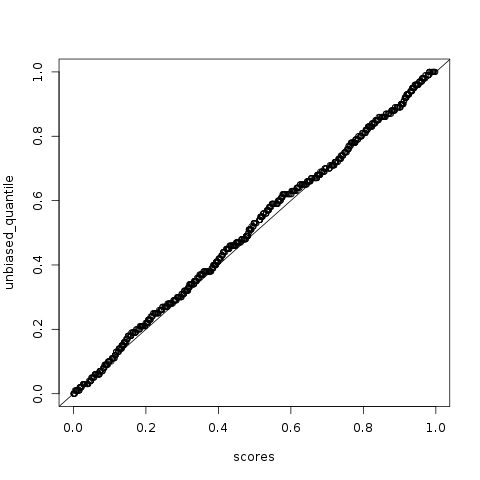
The qqplot is nice and straight: generally drivers in this setup are accurately summarizing their true rank. In this simulation on 49.3% of drivers thought they were better than the median driver.
Now let's add a twist. Suppose when you're sitting at a stop light the road when all of a sudden a SUV jumps ahead of you to illegally run the light. You're going to remember that. But are you going to remember the sedan right next you that quietly waited for the light to turn green? Not so much. This is known as availability bias: the tendency to to overestimate the probability of more memorable events such as the SUV.
To incorporate availability bias into the model, we weight bad drivers 5x more likely to be sampled than good drivers. This results in the following graph
for(ii in 1:nDrivers) {
    weights <- ifelse(scores[-ii] < 0.5, 5, 1)
    obs <- sample(scores[-ii], nObservations, FALSE, weights)
    biased_quantile[ii] <- mean(scores[ii] >= obs)
}

qqplot(scores, biased_quantile)
abline(a = 0, b = 1)
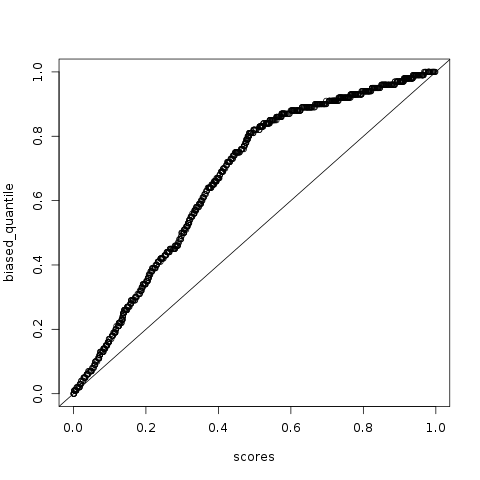
Notice the kink in the graph. By observing bad drivers more often, every starts to overestimate their own driving. Presumably they think "I may be bad, but at least they're not the person going the wrong way on the freeway". With this setup a full 68.4% of drivers think they're above the median driver.
So yes, it's possible for more than 50% of people to think they're above the median value. But before you go impugning their character, consider that cognitive heuristics and biases might have a role to play. Or just don't bring it up at lunch with a stats nerd.