Fun with Grad Cafe data
My classmate Lee Richardson and I were discussing the website GradCafe last night and their database of admissions decisions. This morning he sent me a link to an R package brewdata which scrapes results off the site, cleans it, and puts it into a nice R dataframe.
Because I have nothing better to do 1 I decided to have some fun with the data.
Warnings
- This data is cool, but it's a non-probability sample. That means that any conclusions we might draw don't necessarily generalize2 to the broader population of applicants to statistics programs.
- Don't take this as an endorsement of GradCafe. If you're currently in the process of waiting for admissions decisions, under no circumstances should you look at GradCafe. Relax, enjoy your senior year of college or current job, and know that anxiously refreshing your browser to see the latest news does nothing for your admissions chances.
The Data
I'm going to focus on 2014 data which has data on 589 applications.
To enable me to answer some of the questions I'm going to try and identify unique individuals. To do this I used the reported GPA and GRE scores to pick out individuals. If two records share the same GPA and GRE scores then I declare them to be from the same individual. This gives me 128 individuals with a total of 241 applications to 62 schools.
Questions
When do you hear back?
Part of the reason why I suggest that people avoid looking at GradCafe during admissions seasons is that it leads to anxiety. The longer you wait and the more acceptances you see on the website, the more likely you expect to be denied. Equipped with data, we can examine the veracity of this belief.
     A  I  O  R  W
Apr  1  0  0  8  0
Dec  6  0  0  0  0
Feb 57  3  0 64  7
Jan 23  3  0 18  1
Mar 23  0  2 20  5
May  1  0  0  0  0
As we see, if you're lucky enough to get a response in December you're sure to be admitted. January is still early and has more acceptances than rejections. February and March have more rejections, but not dramatically so. Sad to say, April doesn't hold much hope.
So it seems that waiting for a response isn't necessarily a sign of disappointment. Just don't wait too long.
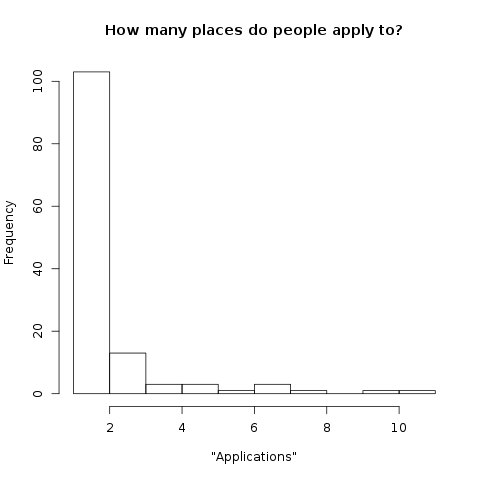
How many places do people apply to?
When I was in the middle of application season I heard a couple different approaches to choosing which schools to apply to. Some people preferred the "shotgun" approach of applying to as many schools as possible in order to "maximize" their likelihood of acceptance. Personally I went with the "only apply if you would want to go there" approach, but I am curious which approach dominates.
It seems that the majority of Grad Cafe participants apply to only one school. I suspected that this is not actually true, rather people are only reporting the school at which they were admitted and accepted. However, 39 out of the 85 individuals that applied to only one school were denied.
Of course, I would be remiss from confirming the obvious. The correlation between acceptances and applications is \(0.6639914\). To borrow from Gretzsky, "You get denied at 100% of the schools you don't apply to."
How important are GRE scores?
Since we're having fun, I'll fit a logistic regression to see how important grades and test scores. Don't put any stock into the statistical significance of GPA.
Call:
glm(formula = (decision == "A") ~ scale(gpa) + scale(gre_v) +
    scale(gre_q) + scale(gre_aw), family = binomial, data = dta)

Deviance Residuals:
    Min       1Q   Median       3Q      Max
-1.3604  -1.1200  -0.8881   1.1248   1.8622

Coefficients:
              Estimate Std. Error z value Pr(>|z|)
(Intercept)   -0.21356    0.14129  -1.511   0.1307
scale(gpa)     0.33068    0.13841   2.389   0.0169 *
scale(gre_v)   0.28419    0.28160   1.009   0.3129
scale(gre_q)   0.34868    0.38956   0.895   0.3708
scale(gre_aw) -0.02399    0.34363  -0.070   0.9443
---
Signif. codes:  0 ‘***’ 0.001 ‘**’ 0.01 ‘*’ 0.05 ‘.’ 0.1 ‘ ’ 1

(Dispersion parameter for binomial family taken to be 1)

    Null deviance: 333.83  on 241  degrees of freedom
Residual deviance: 321.51  on 237  degrees of freedom
AIC: 331.51

Number of Fisher Scoring iterations: 6
I don't particularly like this model, specifically the linearity of the scores. I imagine that a cutoff model would be more appropriate. However, this means little when considering the larger issue: omitted variable bias. We have no data on letters of recommendation, previous research experiences, undergrad institution, etc. I suspect that these have a larger impact on admission decisions than test scores.
Discussion
This gets to a greater questions: how random are grad school admissions? The data that we have available is a good summary of some of the objective measures of applications: GPA and test scores. But there's all of the subjective aspects to consider. This reminds me of the NIPS experiment. I wonder how often admissions committees would agree on students?
Footnotes:
Not true, but playing with data is more fun than measure theory.
Of course, I could have some fun with MRP (see this paper), but that would require a lot more data and a better understanding of why people participate on Grad Cafe.