Data Splitting
A quick review of p-values
Feel free to skip to the next section if you're already familiar with p-values.
The purpose of a p-value is to control the type 1 error rate. You can think of a type 1 error as being the statistical equivalent of crying wolf; it's when we say there's an signal, but it's really just noise. We want to minimize these errors because, much like in the fable, if we make too many people will stop believing us.
At the same time we also want to avoid type 2 errors, times when we miss a true signal.
Thus, the whole enterprise can be summed up as a guarantee:
Over our lifetime of making many such tests, we'll have cried wolf only about \(\alpha\) percent of the time. We also tried to minimize the number of true effects we miss, but we make no promises there.
Under the null hypothesis \(H_{0}\) the p-value of test is distributed uniformly over \([0,1]\) which implies that
\begin{equation*} \Pr(p < \alpha \mid H_{0}) = \alpha \end{equation*}for our chosen significance level \(\alpha\). So if the null hypothesis is true, rejecting the null above \(\alpha\) and failing to reject the null below gives us a type 1 error rate of \(\alpha\).
If we don't have the correct1 distribution for the p-values, we've lost our guarantee. We would be raising false alarms at some unknown rate.
Why inference after model selection is bad
Generally when we're doing model selection we're picking out the explanatory variables which are most correlated 2 with our response variable. The result is obvious; if we're picking variables based upon being highly correlated with the response variable, we shouldn't be surprised when the variables we pick are highly correlated with the response variable.
The problem is that under the null hypothesis the variable isn't correlated with the response; but by chance some variables are going to be more correlated than others. Thus we'll pick out exactly these variables which by chance appear to be significant.
Then when we run our significance test we don't account for this selection effect. Thus the p-values are going to be too small3. Too small p-values means that we haven't achieved our promise of a type-I-error rate of \(\alpha\).
Data splitting to the rescue
This conclusion is unsettling; it appears that we can either do model selection or inference, but not both.
We can get around this problem by doing model selection and inference on two different data sets. We split our original data into two pieces, run whatever model selection process we wish on the first half, and then use the second half to make inferences conditional on the model chosen in the first half.
For details you can start with this Normal Deviate post.
A nice thing about this method is that it assumes nothing about the variable selection process.
A simulation
To see the extent of the problem we'll run a simulation of linear regression after model selection. We'll fit the following model
\begin{equation*} Y = \beta X + \epsilon \end{equation*}where \(\epsilon \sim N(0,1)\) and the null hypothesis is \(\beta = 0\)
For model selection we'll run a regression on the full model and take only the variables that are significant. We could have chosen any kind of model selection procedure, and I've provided a few others; feel free to experiment with them. The code is provided at the following gist.
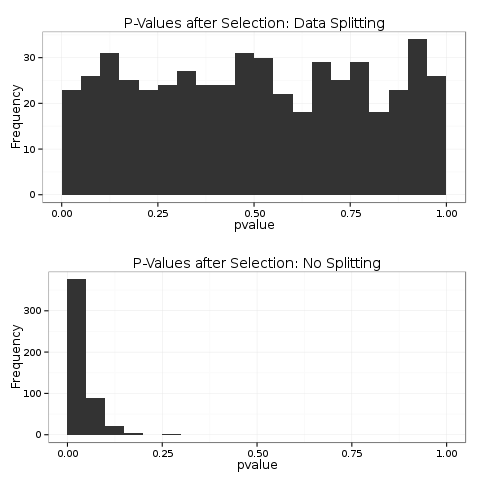
Looking at a histogram of the p-values we can clearly see from the top plot that the data splitting p-values have the correct distribution. The bottom plot shows the distribution after model selection; these are highly concentrated around 0.
Human decision-making
Presumably the most common method of model selection doesn't rely upon an automated method. Instead a human analyst tries out a bunch of models, adds some variables, perhaps uses a transformation, fits interactions, and through some ineffable process arrives at a final model.
Clearly I can't distill this process into a function in R. I imagine that this could be a fun exercise to give to an introductory regression class. Give them each a data set (generated from the null) for homework with instructions to fit a model. Have them report their p-values and show the distribution in class.
Footnotes:
If we knew the distribution of the p-values or more realistically the statistic \(T\) we could "correct" the values by using as our p-values \(p^{*} = F^{-1}(T)\) where \(F^{-1}\) is the inverse-cdf function for \(T\).
This isn't exactly true; we need something more than correlation. However, it gives the right intuition of the problem with selection and then inference.
We could also have the opposite problem where the p-values are too large. This isn't as big of a problem, we still achieve the right type 1 error rate, we're just giving up power. As a check on the intuition, try devising a model selection procedure that will result in larger p-values under the null. What about a model selection procedure that will retain the correct distribution of the p-values?